Sustainability Scorecard
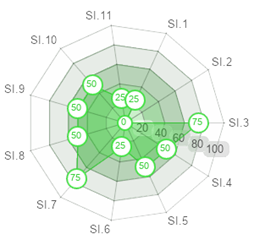
Setting and Infrastructure (SI)
| Indicator | Score |
|
|
| Sl.1 | The ratio of open space area towards total area | 50 | |
| Sl.2 | Area on campus covered in forest | 0 | |
| Sl.3 | Area on campus covered in planted vegetation | 150 | |
| Sl.4 | Area on campus for water absorbance | 50 | |
| Sl.5 | The ratio of open space area divided campus population | 100 | |
| Sl.6 | University budget for sustainability effort | 50 | |
| Sl.7 | Percentage of operation and maintenance activities of building during Covid-19 pandemic | 75 | |
| Sl.8 | Campus facilities for disabled, special needs and or maternity care | 50 | |
| Sl.9 | Security and safety facilities | 50 | |
| Sl.10 | Health infrastructure facilities for students, academics and administrative staff’s wellbeing | 50 | |
| Sl.11 | Conservation: plant, animal and wildlife, genetic resources for food and agriculture secured in either medium or long-term conservation facilities | 25 | |
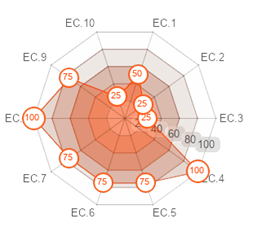
Energy and Climate Change (EC)
| Indicator | Score |
|
|
| EC.1 | Energy efficient appliances usage | 100 | |
| EC.2 | Smart building program implementation | 75 | |
| EC.3 | Number of renewable energy source in campus | 75 | |
| EC.4 | The total electricity usage divided by total campus population | 300 | |
| EC.5 | The ratio of renewable energy production towards total energy usage per year | 150 | |
| EC.6 | Element of green building implementation | 150 | |
| EC.7 | Greenhouse gas emission reduction program | 150 | |
| EC.8 | The ratio of total carbon footprint divided campus population | 200 | |
| EC.9 | Number of innovative program(s) during covid-19 pandemic | 75 | |
| EC.10 | Impactful university program(s) on climate change | 25 | |
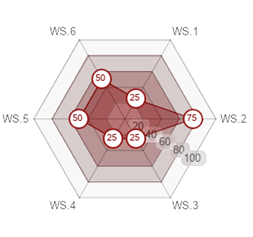
Waste (WS)
| Indicator | Score |
|
|
| WS.1 | Recycling program for university waste | 75 | |
| WS.2 | Program to reduce the use of paper and plastic in campus | 225 | |
| WS.3 | Organic waste treatment | 75 | |
| WS.4 | Inorganic waste treatment | 75 | |
| WS.5 | Toxic waste treatment | 150 | |
| WS.6 | Sewage disposal | 150 | |
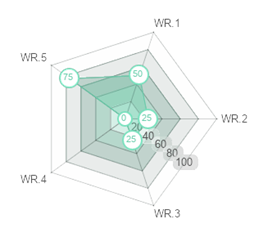
Water (WR)
| Indicator | Score |
|
|
| WR.1 | Water conservation program | 100 | |
| WR.2 | Water recycling program | 50 | |
| WR.3 | The use of water efficient appliances | 50 | |
| WR.4 | Piped water consumed | 0 | |
| WR.5 | Percentage of additional handwashing and sanitation facilities during Covid-19 pandemic | 150 | |
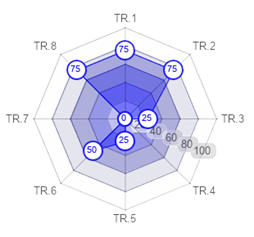
Transportation (TR)
| Indicator | Score |
|
|
| TR.1 | The ratio of total vehicles (cars and motorcycles) divided by total campus population | 150 | |
| TR.2 | Shuttle services | 225 | |
| TR.3 | Zero Emission Vehicles (ZEV) poicy on campus | 50 | |
| TR.4 | The ratio of Zero Emission Vehicles (ZEV) divided by total campus population | 0 | |
| TR.5 | Ratio of parking area to total campus area | 50 | |
| TR.6 | Transportation program designed to limit or decrease the parking area on campus for the last 3 years | 100 | |
| TR.7 | Number of transportation initiatives to decrease private vehicles on campus | 0 | |
| TR.8 | Pedestrian path on campus | 225 | |
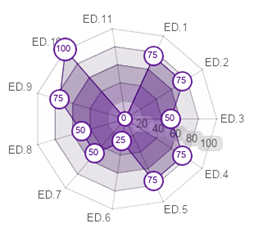
Education (ED)
| Indicator | Score |
|
|
| ED.1 | The ratio of sustainability courses towards total courses/modules | 225 | |
| ED.2 | The ratio of sustainability research funding towards total research funding | 150 | |
| ED.3 | Sustainability publications | 100 | |
| ED.4 | Sustainability events | 150 | |
| ED.5 | Sustainability student organizations | 150 | |
| ED.6 | Sustainability websites | 50 | |
| ED.7 | Sustainability report | 50 | |
| ED.8 | Sustainability report | 50 | |
| ED.9 | Sustainability report | 75 | |
| ED.10 | Sustainability report | 100 | |
| ED.11 | Sustainability report | 0 | |